PASSIONATELY CURIOUS

  • Home
  • About
  • Blog
    • Recent Posts
  • Resources
    • Lessons by Topic >
      • Motion
      • Forces
      • Energy
      • Momentum
      • Circular Motion
      • Waves
      • Electricity
      • Atomic Physics
      • Astrophysics
      • Periodic Table
      • Bonding
      • Chemical Reactions
      • Nature of Science
      • Engineering
    • Collections >
      • Demonstrations
      • Mystery and Breakout Tasks
      • Team Building
      • Mystery Pixel Art
      • Google Form Walk Arounds
      • Design Problems
      • Microsoft Excel
      • Online/Hybrid Lessons
    • Posters
    • 3D Printed Kits >
      • Ionic Bonding Puzzle
      • Radioactive Dice
      • Tangential Velocity Launcher
      • Double Slit - Physical Model
      • Button Battery LED Holder
      • Resonator
      • Cup Balance
      • Penny Circles
    • Teaching Strategies
    • Sessions and Speeches
    • Just For Fun >
      • Science Memes
      • Science Songs
      • Top Tweets
  • Notes
    • Motion
    • Forces
    • Circular Motion
    • Energy and Momentum
    • Waves
    • Electricity
    • Force Fields
    • Thermal Physics
    • Atomic Physics
    • Energy Production
    • Astrophysics
  • IB Physics
    • Units
    • Content Guides
    • Notes
    • Review Guides
    • IA Resources
    • Test Review
    • Study Guide
  • Store
  • Contact Me

Blog

Excel - Solving with Formulas

7/4/2018

Comments

 
In an age where the ability to program is so valuable, I see formulas in Excel to be a gateway in understanding programming logic, syntax, and process. 

Note: In this tutorial, I am focusing on using these files on Excel's iPad App but the materials and structure of the lesson will work just as well on a computer :)

Structure of the Lesson

​To maximize our time practicing formula skills, I put together a file where the structure, formatting and data is already done so the students are only required to use formulas to complete each task. Each worksheet is in its own tab along the bottom of the file and is intended to walk students through several different skills that will be useful to them when using Excel. In my classroom, I typically use the first few tabs as a full class tutorial and allow them to complete the rest on their own while I circulate the room.

Below is a list of the tasks and skills introduced for each of the worksheets:
Worksheet Title
Task
Skills Introduced
Using Formulas
Calculate the statistics for the masses of US coins
Using built in Excel Formulas
  • average()
  • sum()
  • max()
  • min()
Density Calculator
Build a calculator to solve for the unknown in a density equation
Writing Custom Formulas 
Grade Calculator
Calculate the test percentage for each student in the class
Number Formatting and Formula Propagation
Distance Table
Calculate statistics from a table of distances between cities
2D Data Selection
Lab Data
Complete a lab data table with pattern fill and averages
Pattern Fill and Averaging Trial Data
Picture
​Here are the excel files with all the exercises to provide to students to download. For more info about providing editable files to students with iPads, see the post on teaching Excel with iPads.
Excel - Formulas.xlsx
File Size: 23 kb
File Type: xlsx
Download File

Excel - Formulas - KEY.xlsx
File Size: 24 kb
File Type: xlsx
Download File


Excel Skills on the iPad - How To

Using Built in Formulas
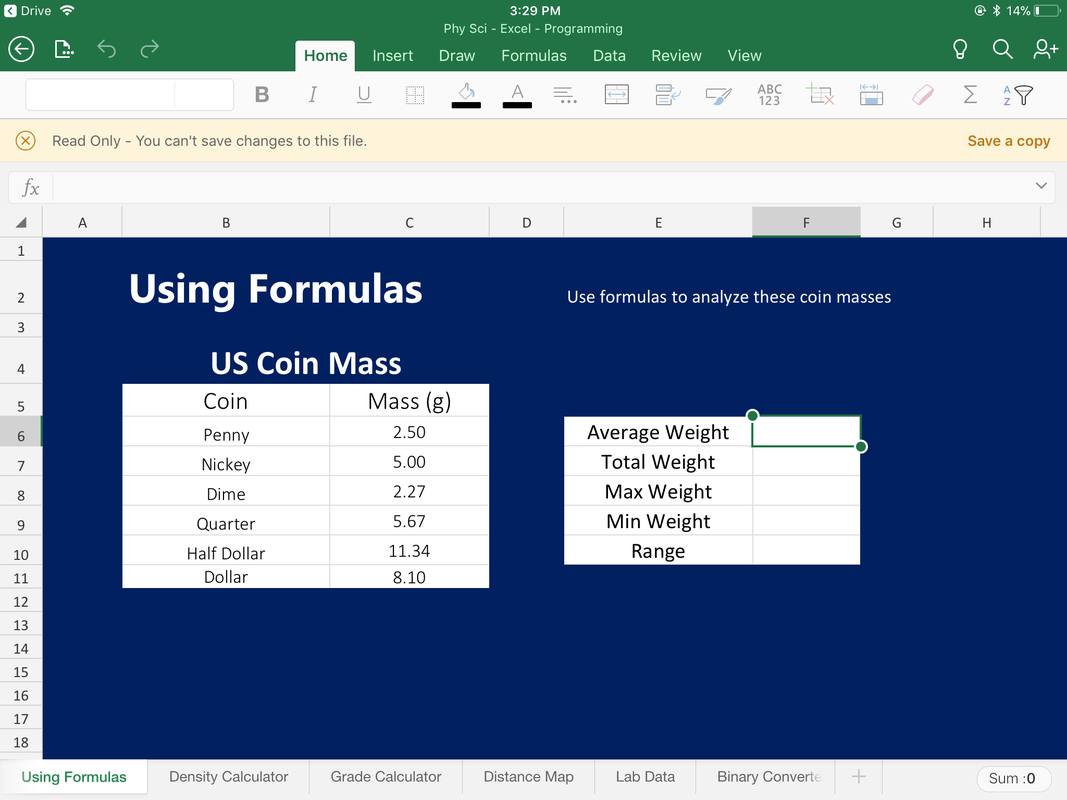
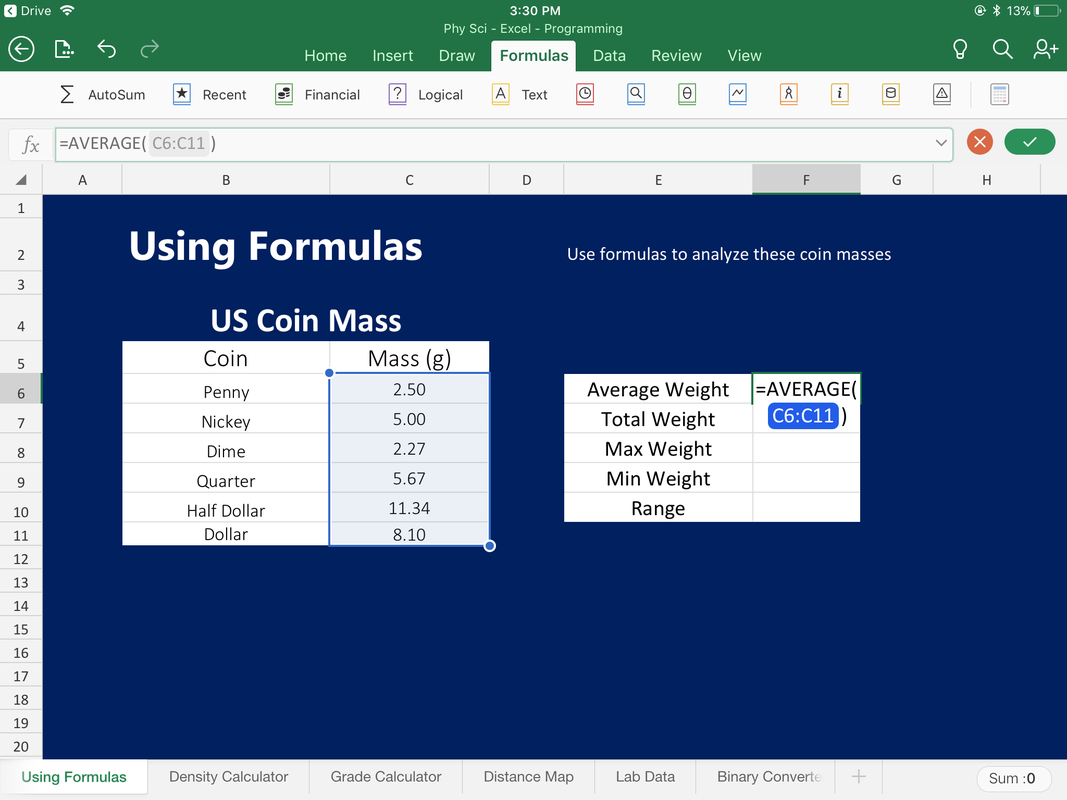
In the iPad Excel App, I have found that the most commonly used formulas are very easy to find in the Formulas tab at the top of the window. In the worksheet labeled "Using Formulas" students are tasked with calculating average, sum, max, min, and range. For the first four of these tasks, there is a built in formula that can be found in the AutoSum menu.
Picture
Picture
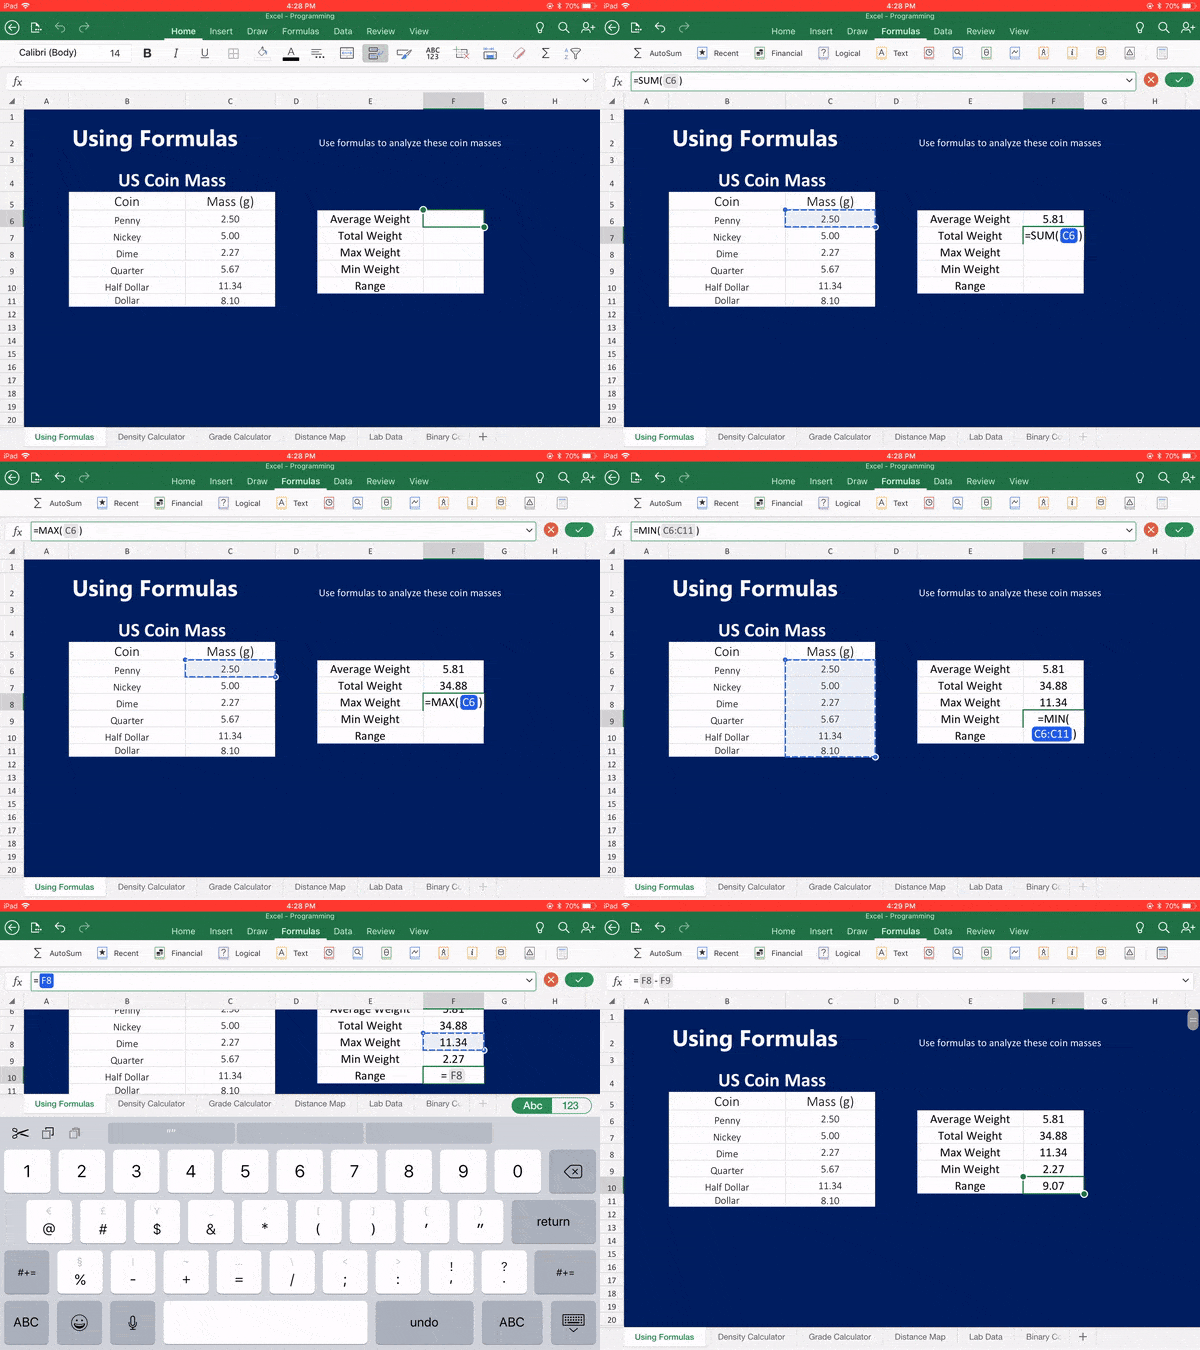
Once the proper formula has been chosen, the data can be selected by dragging the corners of the selection box to include the desired values. To calculate the range, students can construct their own formula by taking the difference between the max and min values. To do this in a responsive manner, they will need to type "=F8-F9" with the equals sign indicating the start of a formula and the cell locations included by tapping on the intended cell value.

Custom Formulas
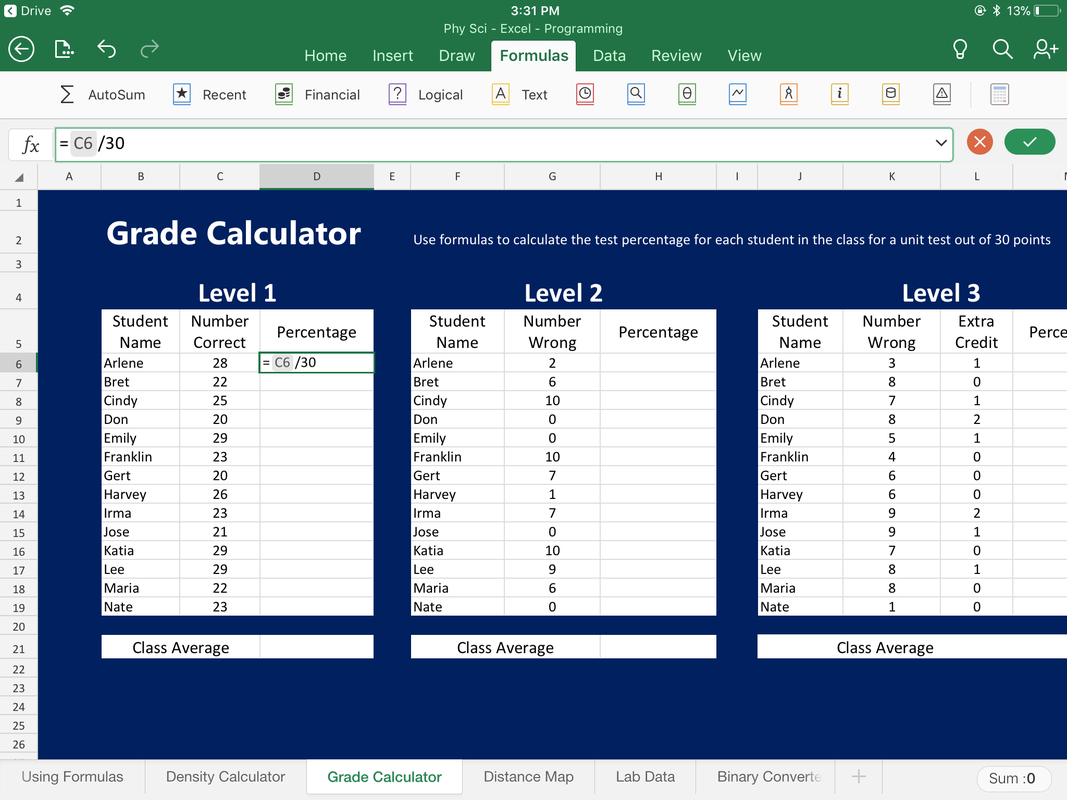
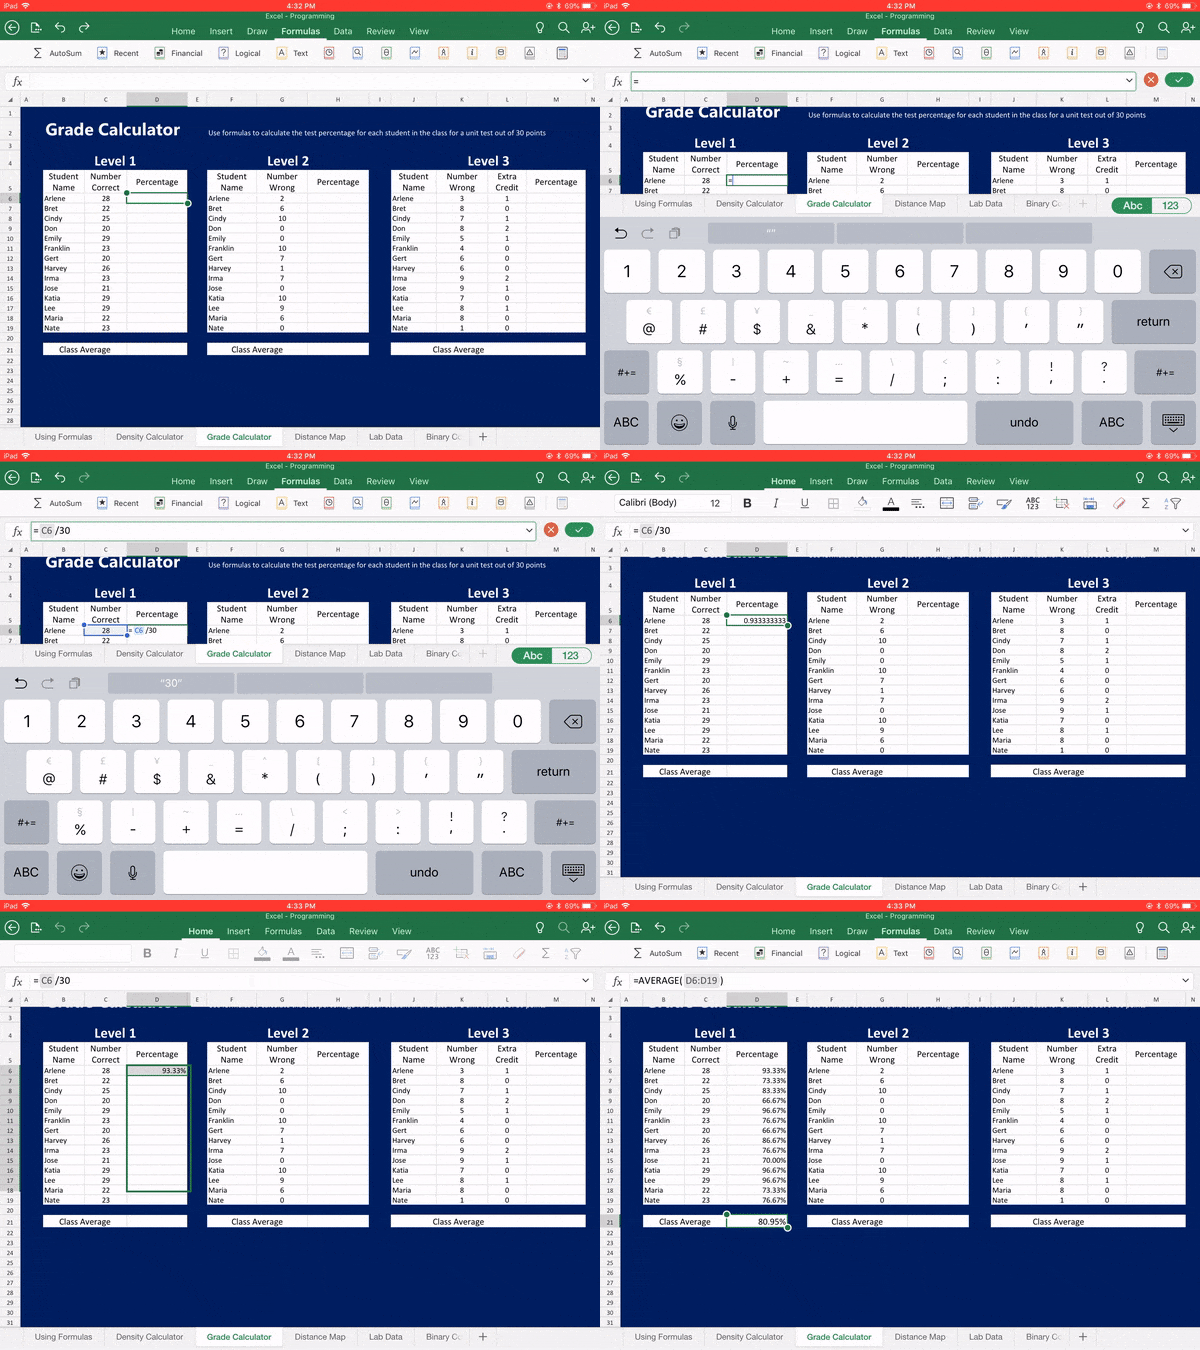
In the case of the "Grade Calculator" worksheet, students will need to calculate percentage based on a few different grade recording techniques. For each of these, students will need to create a custom formula that references the cells that contain the necessary values as shown in the formula in cell D3 of the screenshot below.
Picture

Number Formatting
When the formula above is used to calculate a percentage, the resulting number will of course be a decimal rather than a percent. Instead of multiplying the result by 100, it is cleaner to change the number format. In the Home tab at the top of the window, there is an "ABC123" icon that, when clicked, provides many different formatting options.
Picture

Formula Propagating
One of the most powerful uses of a spreadsheet is to propagate formulas to eliminate repetitious number crunching when the mathematical procedure is always the same. The Grade Calculator is an excellent example of this method because each cell needs to divide the value in the left-adjacent cell by the total points possible (in this case, 30). The process for copying this formula to the rest of the column is slightly different from the desktop version but not too hard if you know where to find it.
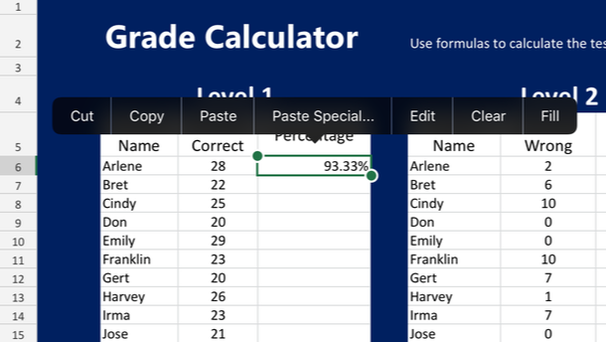
First of all, you must either "tap-pause-tap" or "hold and release" the cell that contains the formula that you wish to copy. If done correctly, you will see a menu bar appear with the options to cut, copy, edit, clear, and fill (along with some others if you have data stored on the clipboard). If you select Fill, the shapes in the top left and bottom right hand corners of the highlighted cell will turn from circles to squares.
Picture
Picture
Picture
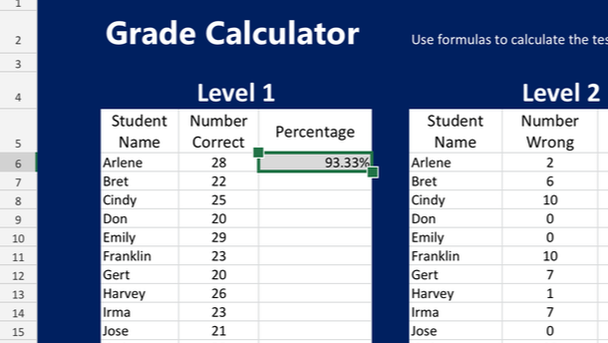
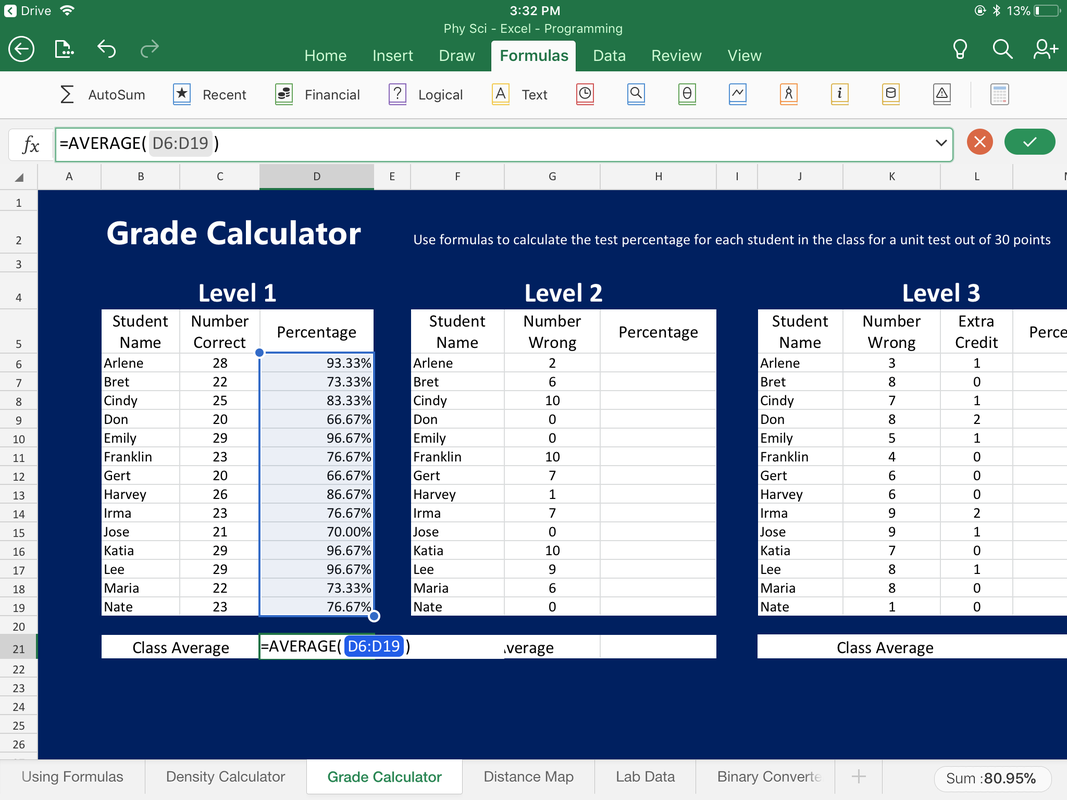
Once the selection shows squares on the corners, dragging the corners will copy the original formula into the newly selected cells. The screenshot below shows that not only did the formula get propagated, but so did the percentage formatting. Once the data is complete, students can once again copy use the AVERAGE() formula to calculate the average.

Using Formulas

Use formulas to analyze these coin masses
Picture
  1. Select the empty cell to the right of the Average Weight label. Insert a built-in average formula by going to the Formulas menu and selecting AutoSum ⇨ Average
  2. Drag the corners of the automatic selection to select the data in the mass column of the US Coin Mass table (be careful to only include the numerical values in this selection). If you have done this correctly, the formula should read "=AVERAGE(C6:C11)"
  3. Select the empty cell to the right of the Total Weight label. Insert a built-in sum formula by going to the Formulas menu and selecting AutoSum ⇨ Sum. Update the data selection as before
  4. Select the empty cell to the right of the Max Weight label. Insert a built-in maximum formula by going to the Formulas menu and selecting AutoSum ⇨ Max. Update the data selection as before
  5. Select the empty cell to the right of the Min Weight label. Insert a built-in minimum formula by going to the Formulas menu and selecting AutoSum ⇨ Min. Update the data selection as before
  6. Select the empty cell to the right of the Range label. Since there is not an easy built-in formula for range, you must construct your own formula by taking the difference between the max and min values. To do this in a responsive manner, type an equals sign to indicate that you are writing a formula. Next tap on the cell that contains the max value that you calculated in step 4 (your formula should update with the location F8). Subtract from this, the value stored in the min value cell so that you end up with the formula "=F8-F9"

Calculating Density

​Build a calculator that can find the density for any two mass and volume measurements
Picture
Level 1
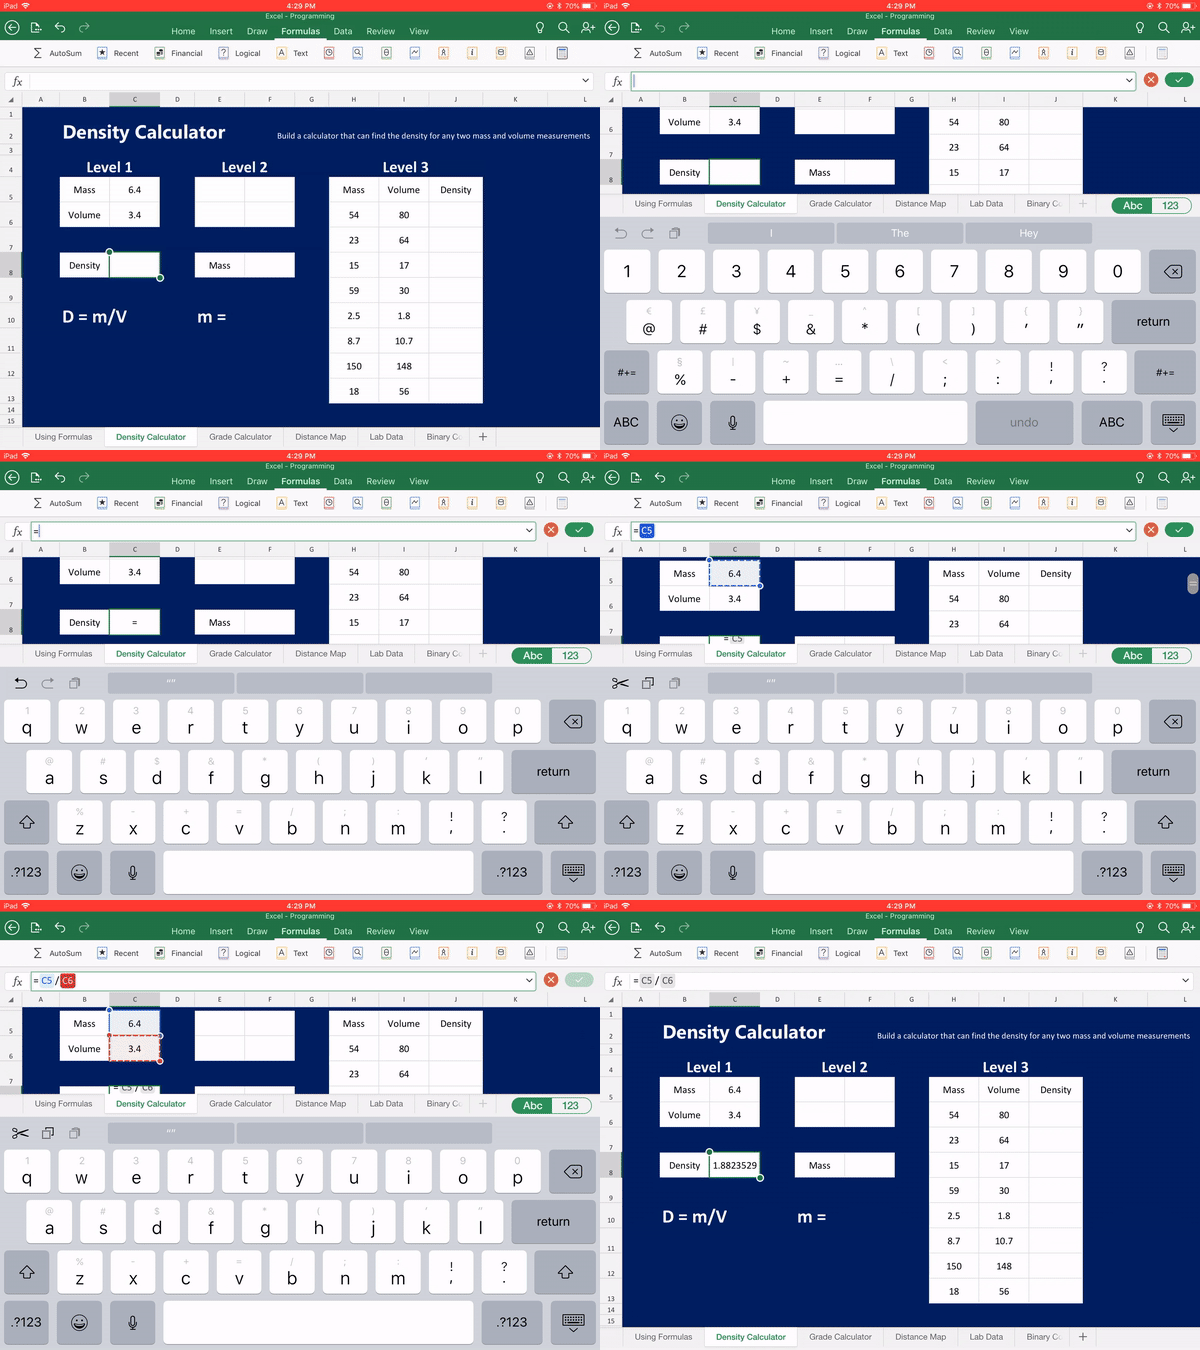
  1. Select the empty cell to the right of the Density label.
  2. Type an equals sign to indicate that you are writing a formula.
  3. Since the formula to calculate density is mass / volume, write the formula "= C5 / C6" by tapping on the intended cell value.
Level 2
  1. Select the empty cell to the right of the Density label.
  2. Type an equals sign to indicate that you are writing a formula.
  3. Since the formula to calculate density is density x mass, write the formula "= F5 * F6" by tapping on the intended cell value. (notice that multiplication in Excel is represented by an asterisk*)
Level 3
  1. Select the first empty cell in the Density column.
  2. Select the empty cell to the right of the Density label.
  3. Type an equals sign to indicate that you are writing a formula.
  4. Since the formula to calculate density is mass / volume, write the formula "= H6 / I6" by tapping on the intended cell value. Make sure that this formula uses the corresponding values in that row
  5. Either "tap-pause-tap" or "hold and release" the cell that contains the formula that you just wrote. If done correctly, you will see a menu bar appear with the options to cut, copy, edit, clear, and fill.
  6. Select Fill so that the shapes in the top left and bottom right hand corners of the highlighted cell will turn from circles to squares.
  7. ​Drag the bottom right hand square down to highlight the entire column to propagate this formula across the entire table. (Note: if you have set up your formula correctly, the references should advance rows along with the equation so that each row calculates its own unique density) 

Grade Calculator

Use formulas to calculate the test percentage for each student in the class for a unit test out of 30 points
Picture
Level 1
  1. Select the first empty cell in the Percentage column.
  2. Type an equals sign to indicate that you are writing a formula.
  3. Since the formula to calculate percentage for this thirty point test is number correct / 30, write the formula "= C6 / 30" by tapping on the intended cell value.
  4. Select the newly calculated value and format this number as a percentage by going to the Home menu and selecting ABC123 (Number Format) ⇨ Percentage
  5. Either "tap-pause-tap" or "hold and release" the cell this calculated percentage. Select Fill and drag the bottom right square until the selection completes the table
  6. With the cell to the right of the Class Average label selected. Insert a built-in average formula by going to the Formulas menu and selecting AutoSum ⇨ Average. Make sure the selection includes all of the class scores.
Level 2
Every step is the same as Level 1 with the exception of Step #3. Since the table indicates the number wrong instead of the number correct, the formula must read "= (30 - G6) / 30" (make sure to use parentheses appropriately so that the formula follows the correct order of operations)

Level 3
Every step is the same as Level 1 with the exception of Step #3. Since the table indicates the number wrong instead of the number correct, the formula must read "= (30 - K6 + L6) / 30" (make sure to use parentheses appropriately so that the formula follows the correct order of operations) 

Distance Table

Collect information from a table of distances
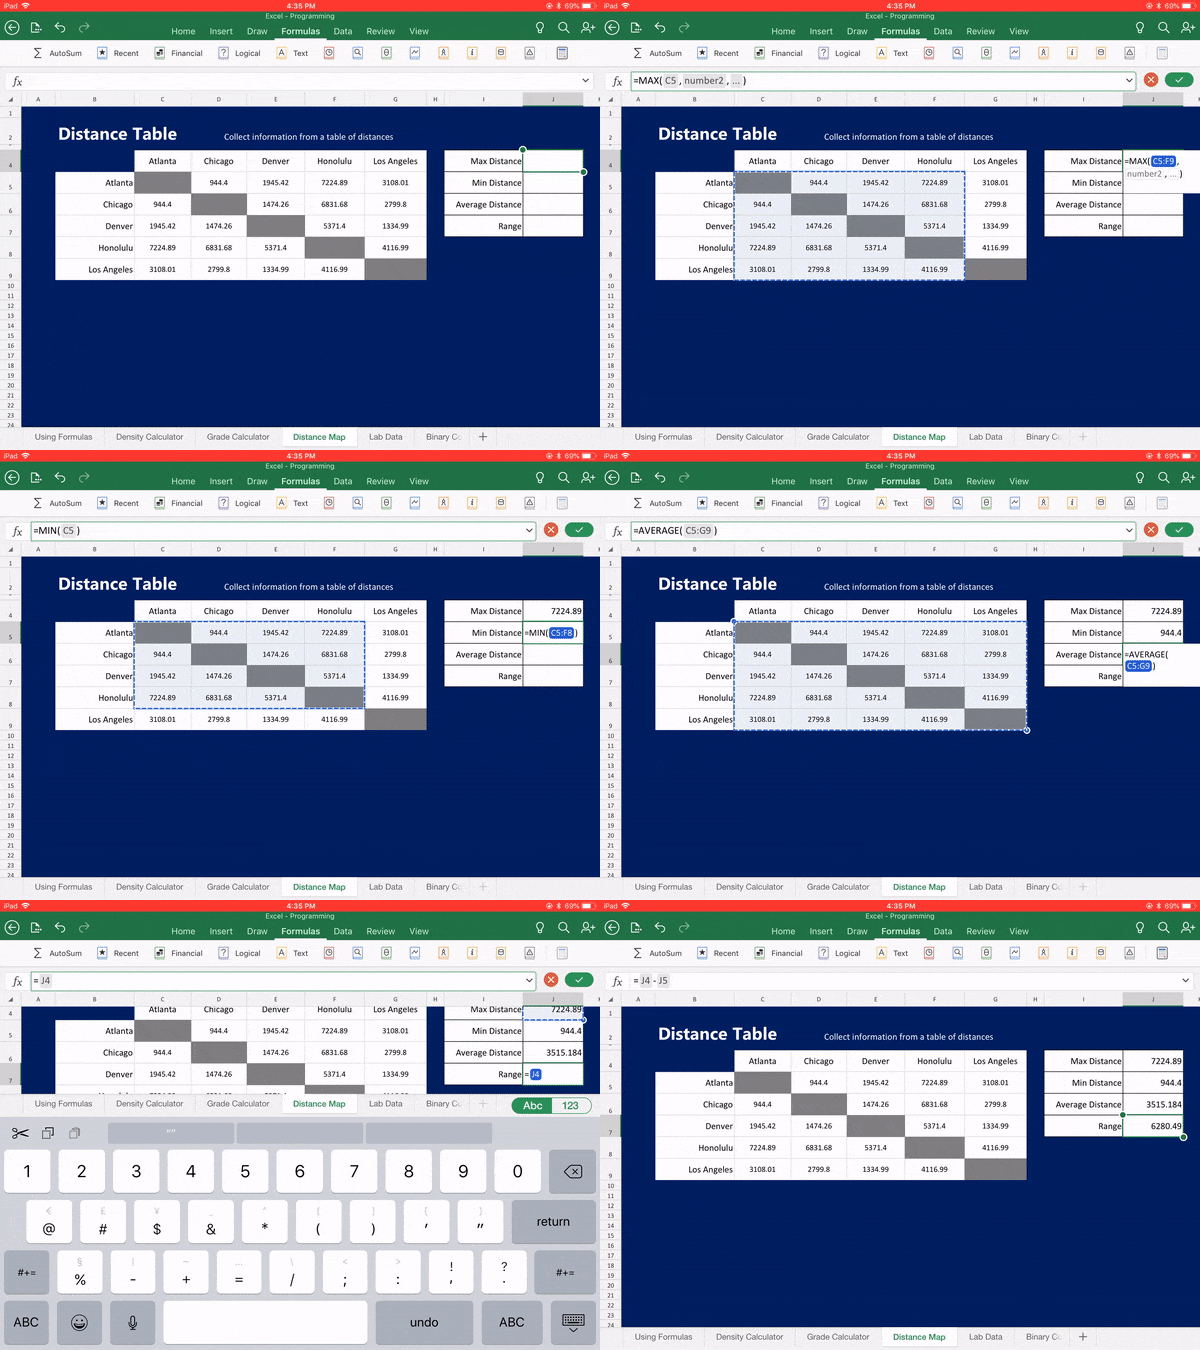
Picture
  1. Select the empty cell to the right of the Max Distance label. Insert a built-in maximum formula by going to the Formulas menu and selecting AutoSum ⇨ Max
  2. Drag the corners of the automatic selection to select ALL the data in the distance table (this can be two dimensions if needed). If you have done this correctly, the formula should read "=MAX(C5:G9)"
  3. Select the empty cell to the right of the Min Distance label. Insert a built-in minimum formula by going to the Formulas menu and selecting AutoSum ⇨ Min. Update the data selection as before
  4. Select the empty cell to the right of the Average Distance label. Insert a built-in average formula by going to the Formulas menu and selecting AutoSum ⇨ Average. Update the data selection as before
  5. Select the empty cell to the right of the Range label. Since there is not an easy built-in formula for range, you must construct your own formula by taking the difference between the max and min values. To do this in a responsive manner, type an equals sign to indicate that you are writing a formula. Next tap on the cell that contains the max value that you calculated above (your formula should update with the location J4). Subtract from this, the value stored in the min value cell so that you end up with the formula "=J4-J5"

Lab Data

​Use formulas to calculate the average
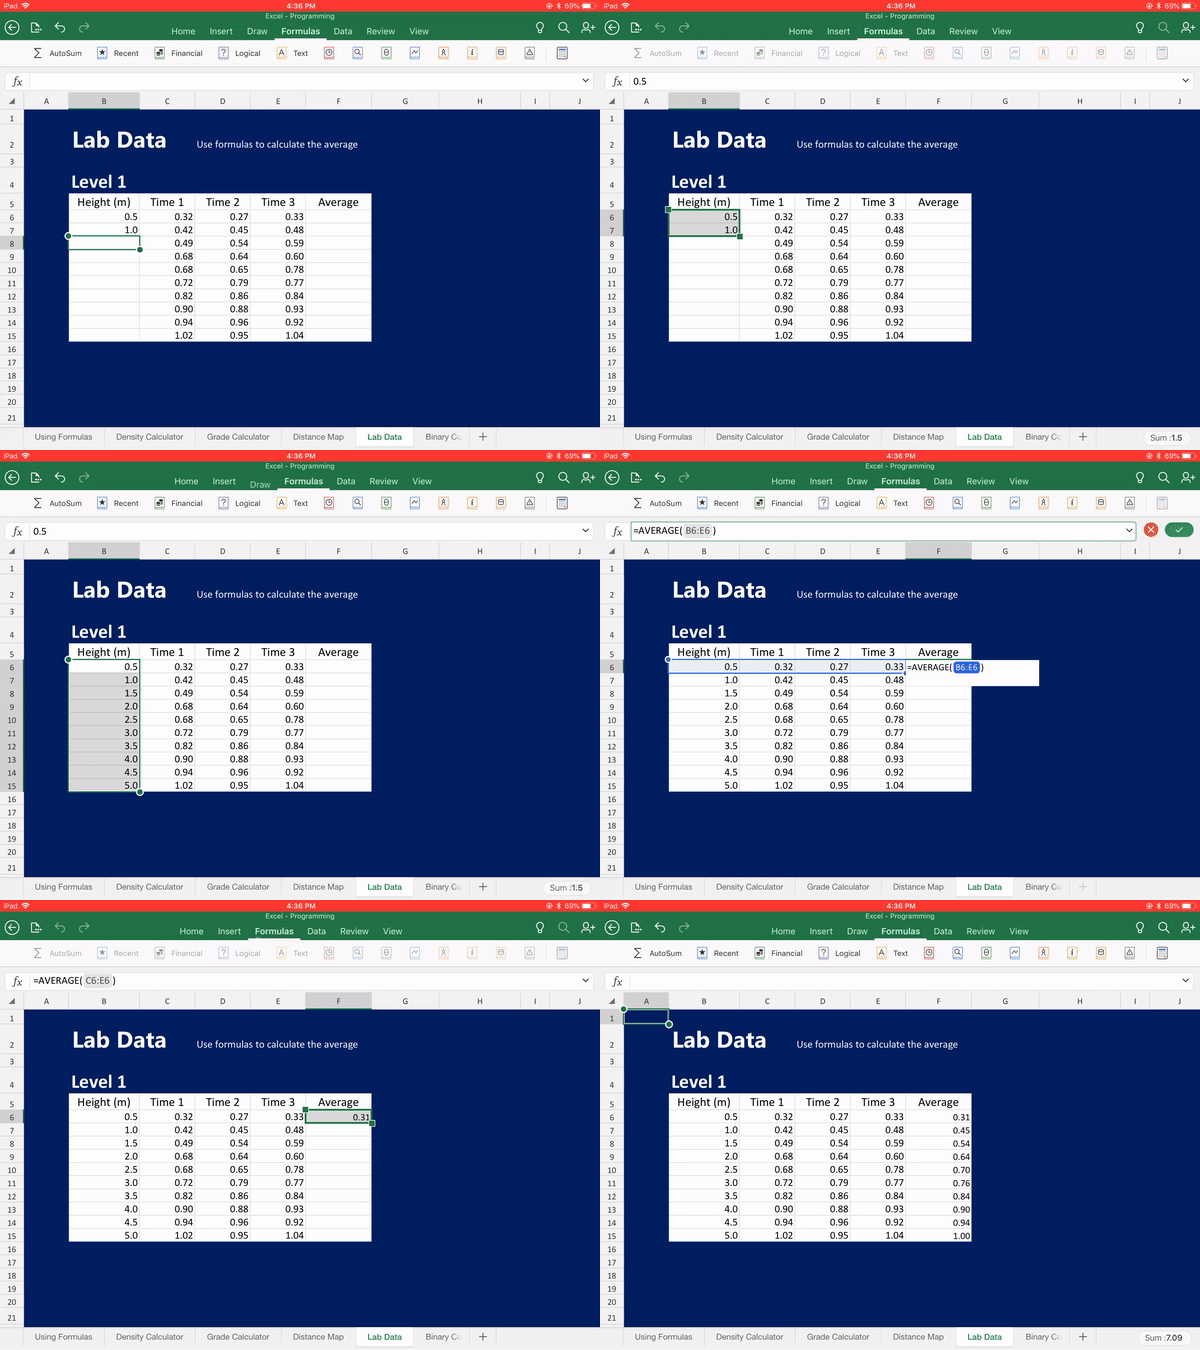
Picture
  1. Select the first two values listed in the Distance column
  2. Either "tap-pause-tap" or "hold and release" this selection. Select Fill to make the selection corners turn from circles to squares. Pull down on the bottom right square to fill the rest of the column in ascending increments of 0.5 m.
  3. In the first row for the Average Time column, add a formula to average the three trials together. This can be done easily by going to the Formulas menu and selecting Autosum ⇨ Average. The resulting formula should be =AVERAGE(C6:E6)
  4. Either "tap-pause-tap" or "hold and release" this newly calculated average. Select Fill to make the selection corners turn from circles to squares. Pull down on the bottom right square to fill the rest of the column.

Files

Excel - Formulas.xlsx
File Size: 23 kb
File Type: xlsx
Download File

Excel - Formulas - KEY.xlsx
File Size: 24 kb
File Type: xlsx
Download File


Follow the links below to get details and materials for the rest of this 4-day unit on Excel

​Incorporating Excel on the iPad

​​Day 1: Solving with Formulas

​Day 2: Graphing from Data

​​Day 3: Graphing Data Collected from a Lab

​​Day 4: Excel Skills Assessment​


Comments
comments powered by Disqus

    RSS Feed

    Picture

    Joe Cossette

    Father, Physics Teacher, Knowles Fellow, Friend, Techie, and Musician

    "Learning to teach teaches me to learn"


    Blog Posts

    • Finding a Habitable Exoplanet
    • Mechanics Super Problem
    • Binding Energy per Nucleon
    • Group Assessment
    • Newton's Law Blocks
    • Plotting the Stars
    • Periodic Aliens
    • Paper Rockets
    • Electronic Holiday Cards​
    • MCwordle Review
    • Bonding Sticker Practice
    • Kiss the Egg​
    • Friction Mini Labs
    • Free Fall Mini Labs
    • Energy Scramble
    • Cryptography Murder Mystery
    • Virtual Circuit Escape Room
    • Internal Resistance Lab
    • Electricity Mini Labs
    • AAPT Presentation
    • When Pigs Fly...
    • Light Mini Labs
    • Sound Mini Labs
    • Mechanics Lab Practical
    • Momentum Mini Labs
    • Energy Mini Labs
    • Mail Merge Assessments
    • Virtual Motion Matchmakers
    • Virtual Motion Escape Room
    • Motion Graph Scavenger Hunt
    • ​The Game of Science
    • Inquiry Cube - "Level Unknown"
    • Inquiry Cubes
    • Sound Wave Interference
    • Circuits Breakout
    • ​Chemical Reactions Crime Scene
    • Bonding Breakout
    • The Missing Piece
    • Groupwork Identity
    • Cup Stack Challenge
    • The Floating Balloon
    • Stop Motion Face Off
    • Motion Graphs Practice
    • Google Form Scavenger Hunt
    • Motion Graph Matchmakers
    • Printable Periodic Table
    • Circuits Scavenger Hunt
    • Energy Scavenger Hunt
    • 1000/24/7 Lectures
    • Up-Goer Five Reports
    • Actionable Norms
    • Writing a Breakout Task
    • Excel on the iPad
    • Excel: Solving with Formulas
    • Excel: Graphing from Data
    • Graphing Lab Data
    • Excel Skills Assessment
    • Energy Breakout​
    • Physics Content Guides
    • Build your own Breakout Kits
    • Building by Design
    • Engineering Communication
    • Google Doc Scavenger Hunt
    • Reflecting on Identity
    • Kinematics Crime Scene
    • Message to the Graduating Class
    • Projectile Murder Mystery
    • Beats by __________
    • The Uncertainty Game Show
    • Data Validation in Google Forms
    • Podcasts
    • Inquiry Cubes

Powered by Create your own unique website with customizable templates.