|
Lab to investigate the mathematical model relating the frequency of a glass instrument to the amount of water inside the glass.
Video WalkthroughThe Tools
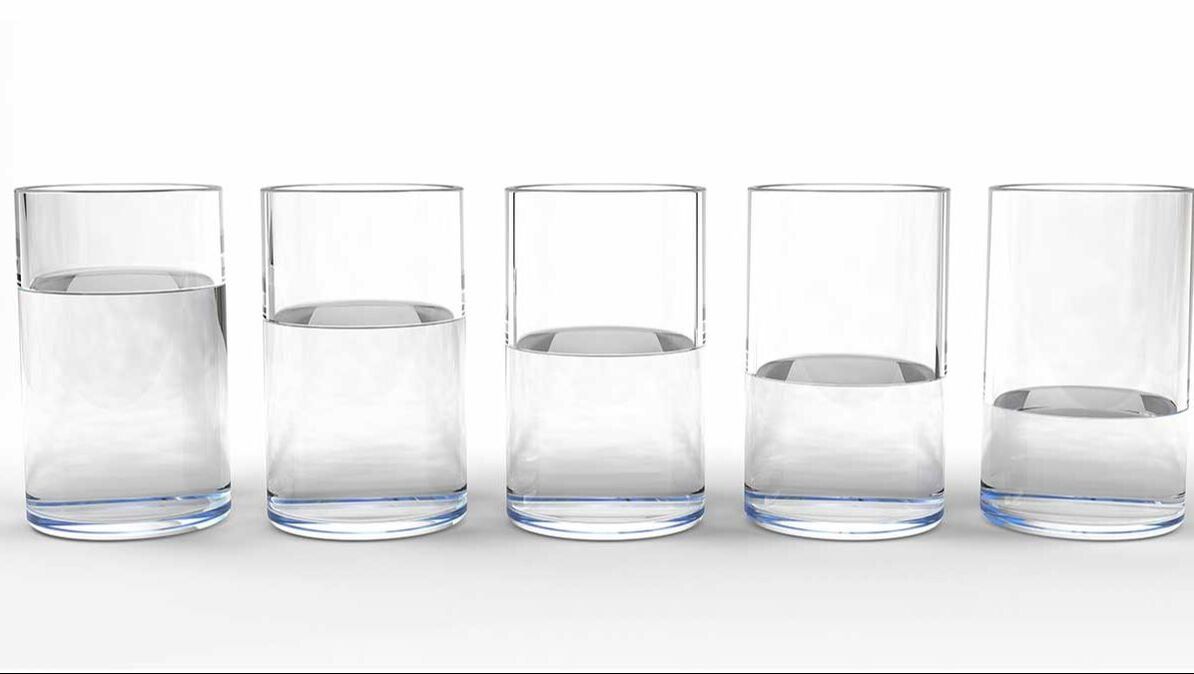
Part 1: Collecting the DataYour lab set up has some choice based on the materials that you have access to. Choose a method for producing a sound and units for measuring out the water. Method for Producing Sound (choose one)
Collect your data by measuring out an amount of water into your container. Create the sound repeatedly using your chosen method and use PhyPhox to measure the peak frequency that is produced. Record your data for four non-zero amounts of water into your spreadsheet and average the three trials for each. 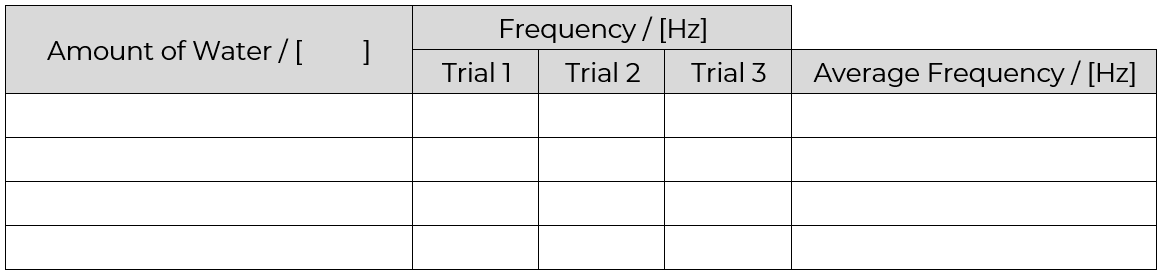 Part 2: The Mathematical ModelCreate a scatterplot of the amount of water and average frequency columns and add a trendline with an equation. Make sure that the independent variable (amount of water) is graphed on the x-axis. Record this trendline equation as the mathematical model for this system. Part 3: Analysis of the Model
Part 4: Testing the Model
Click Here for More LabsClick for more Waves resources ⬇ 
Comments
|

Joe CossetteFather, Physics Teacher, Knowles Fellow, Friend, Techie, and Musician Blog Posts |
||||||||||||


 RSS Feed
