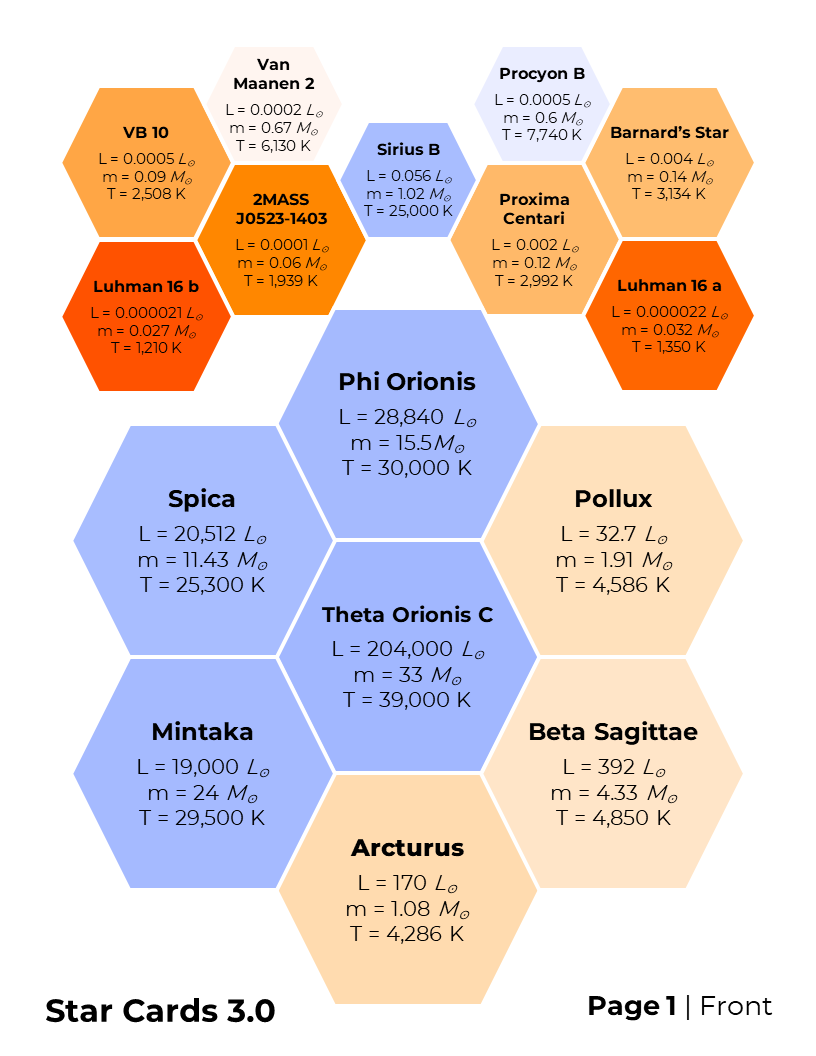
Update: Since I first posted this resource in May 2022, I have become of aware of several inconsistencies with the original data and decided to make some updates in a Version 3.0!! I'm excited to share this activity with data that more accurately resembles accepted data. :)
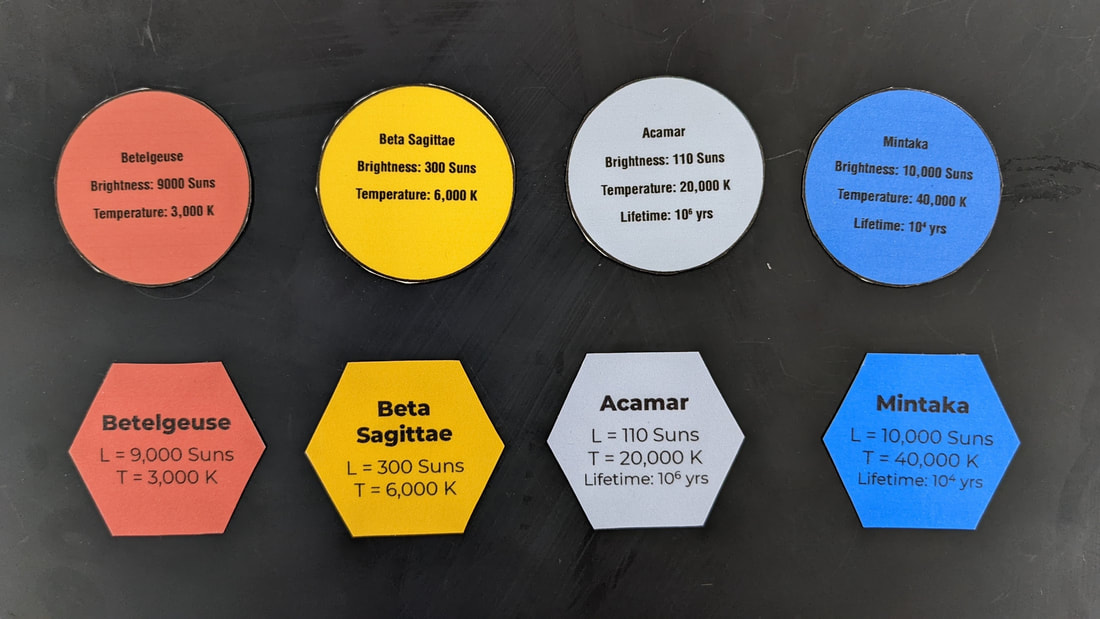
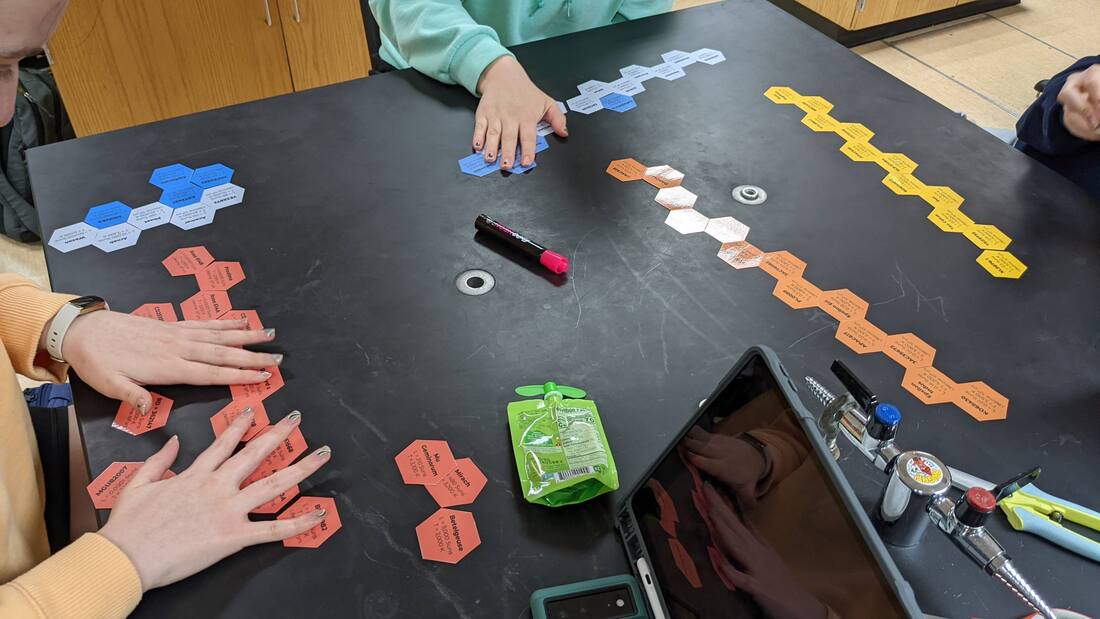
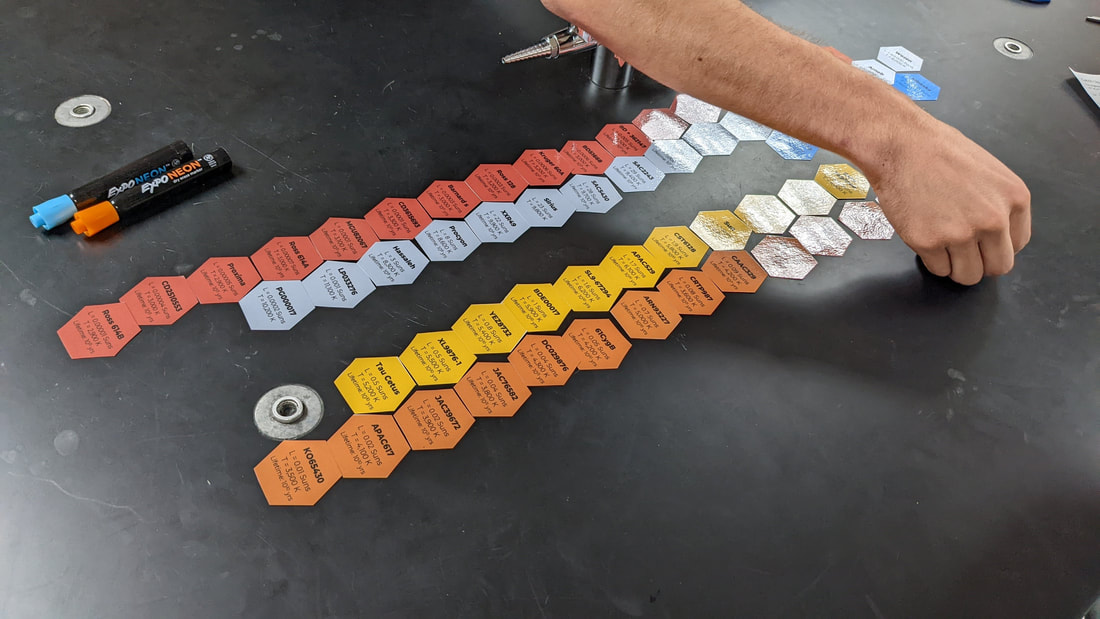
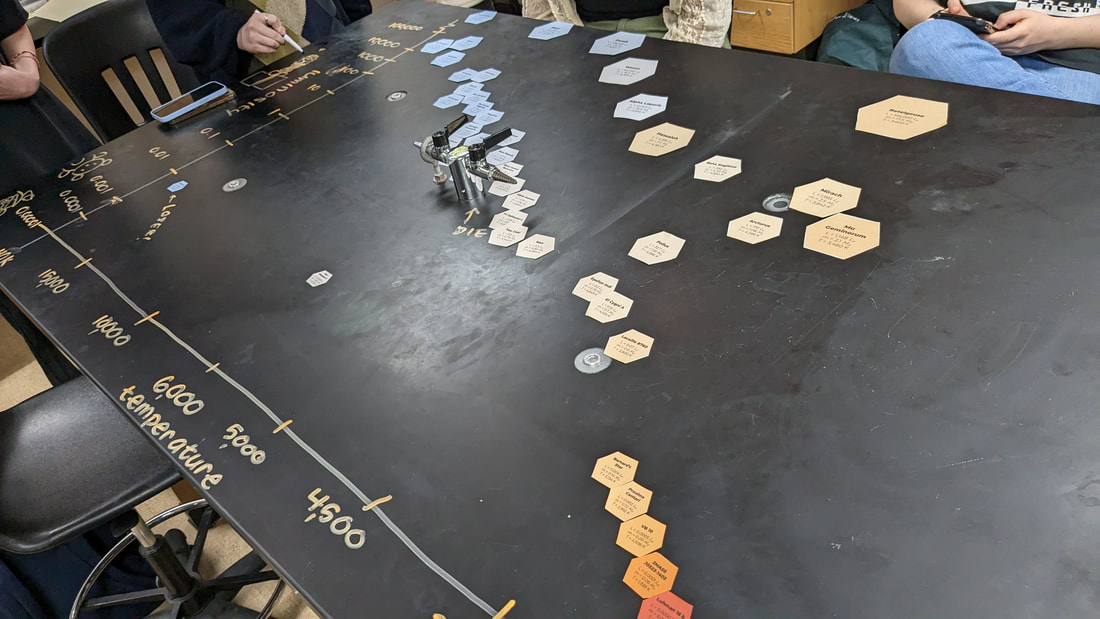
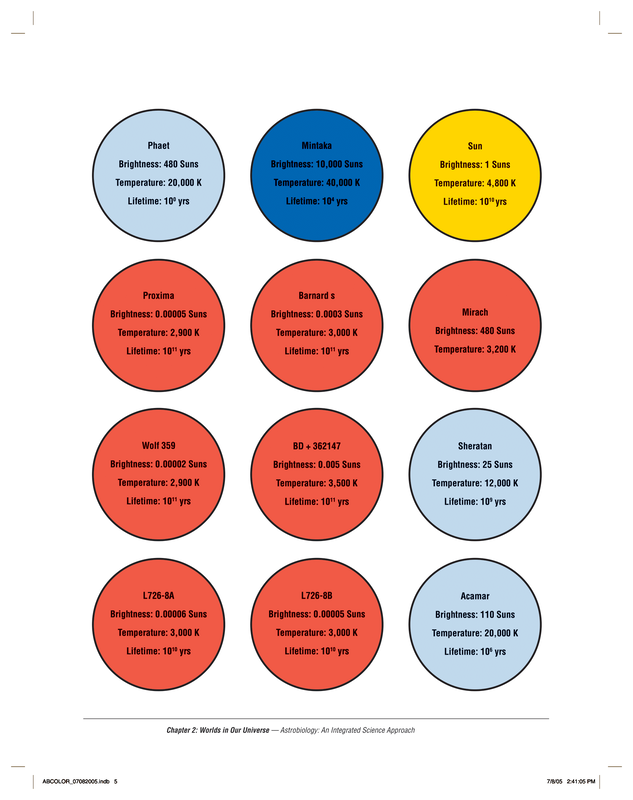
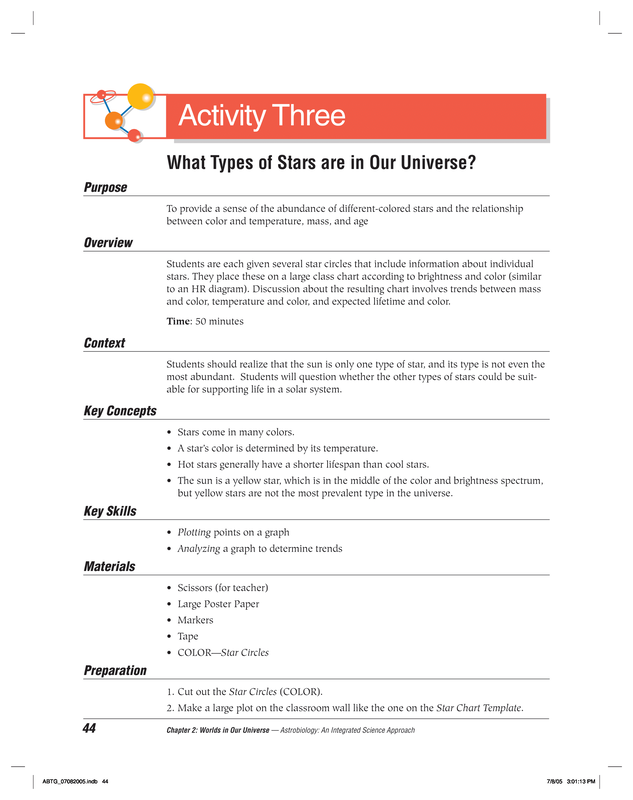
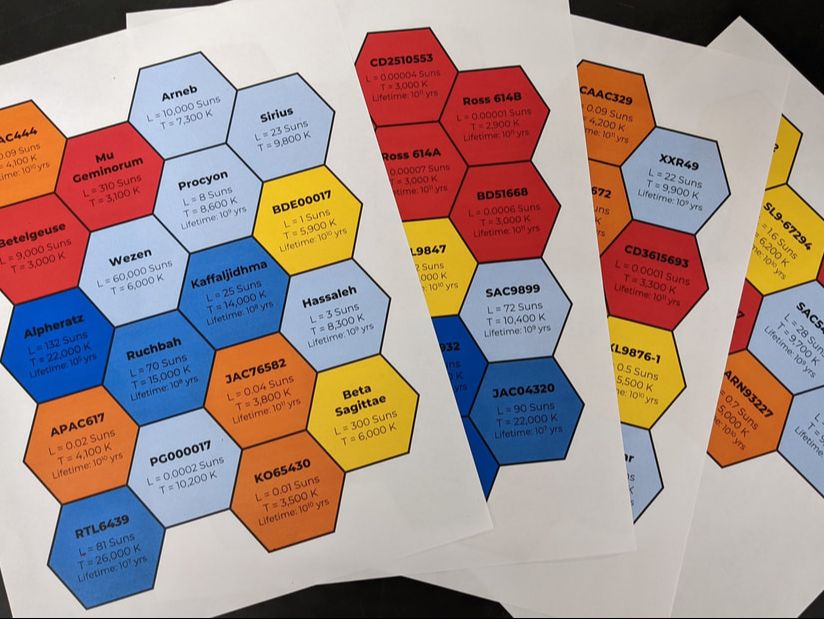
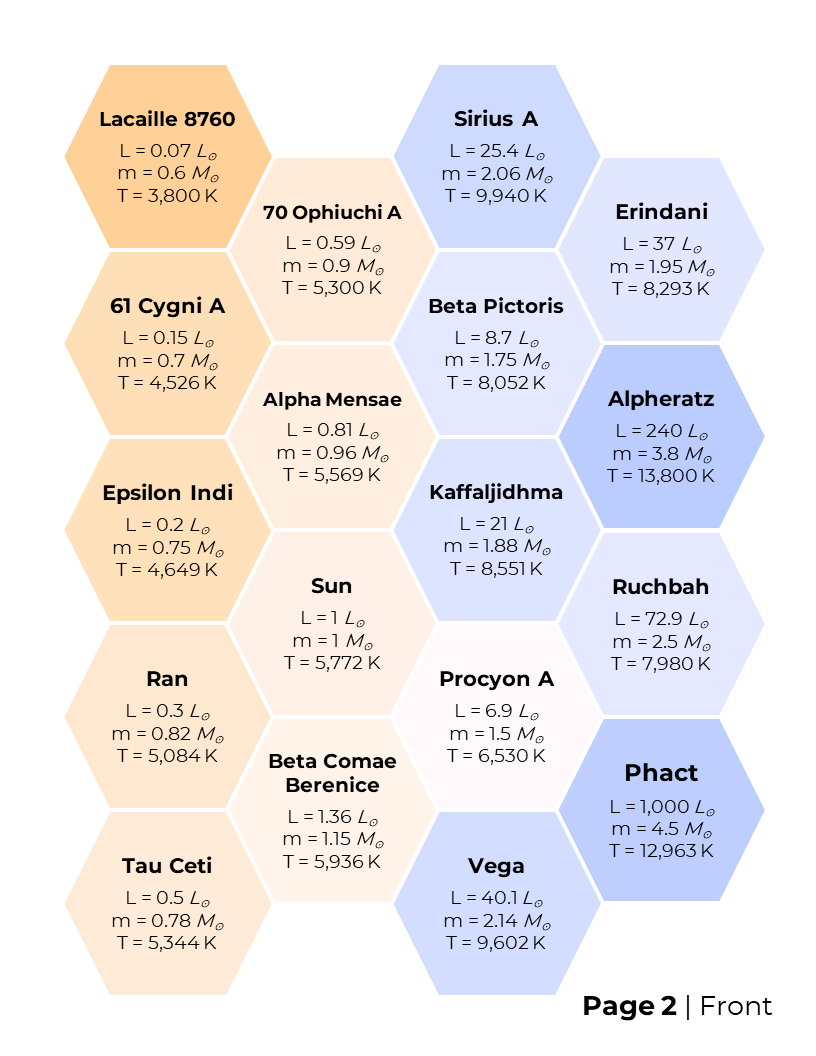
The TaskWhen I do this in my class, I give a set of star cards to each group and instruct them to "organize the stars and look for patterns". Different groups did this in different ways, usually starting with colors and then sorting each group by their luminosity or temperature.
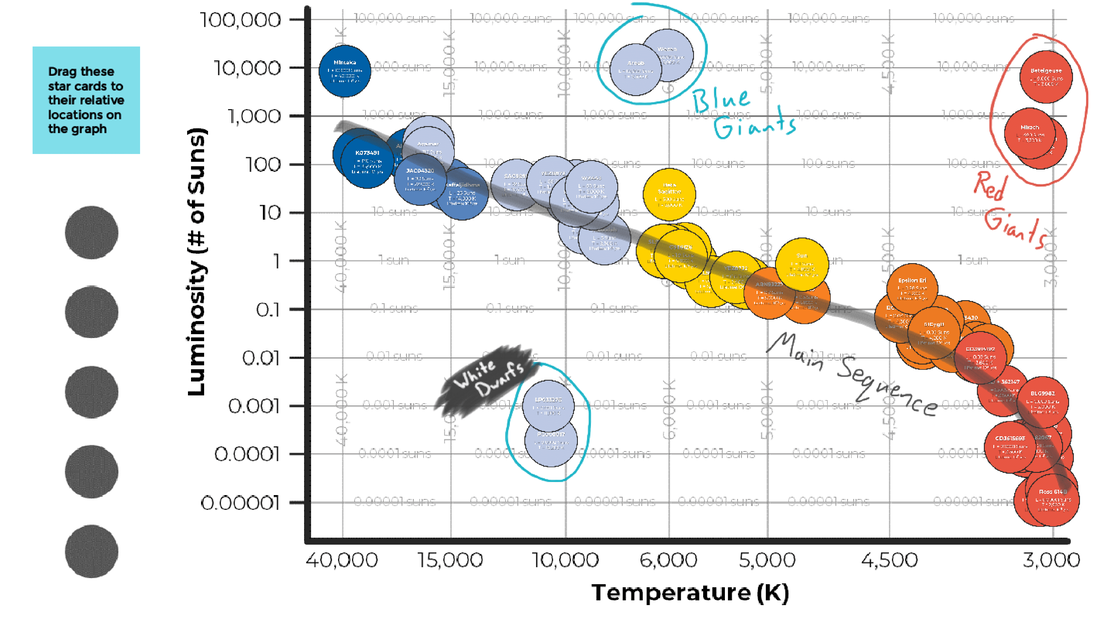
After they have had a chance to explore the stars a little bit, I ask them about patterns that they've noticed. They should notice that the colors map really closely to the temperature but don't necessarily predict the luminosity. For example all the red stars are around 3,000 K but their luminosity could range from 0.0001 suns (red dwarf) to 9,000 suns (red supergiant). Because of this, it is useful to organize these stars in two-dimensions and plot them on a graph
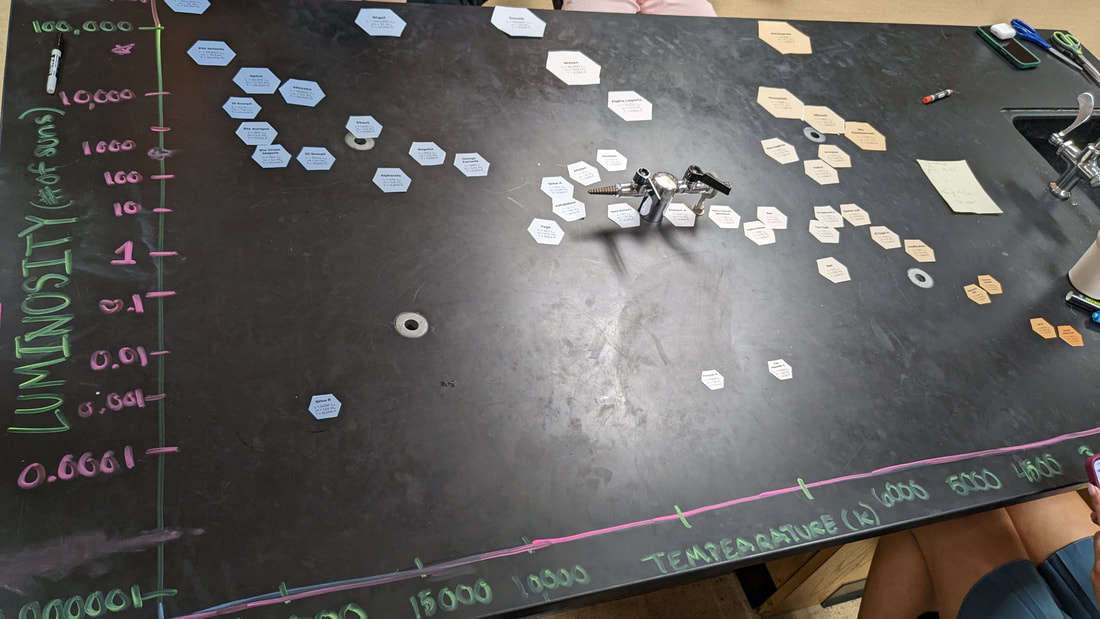
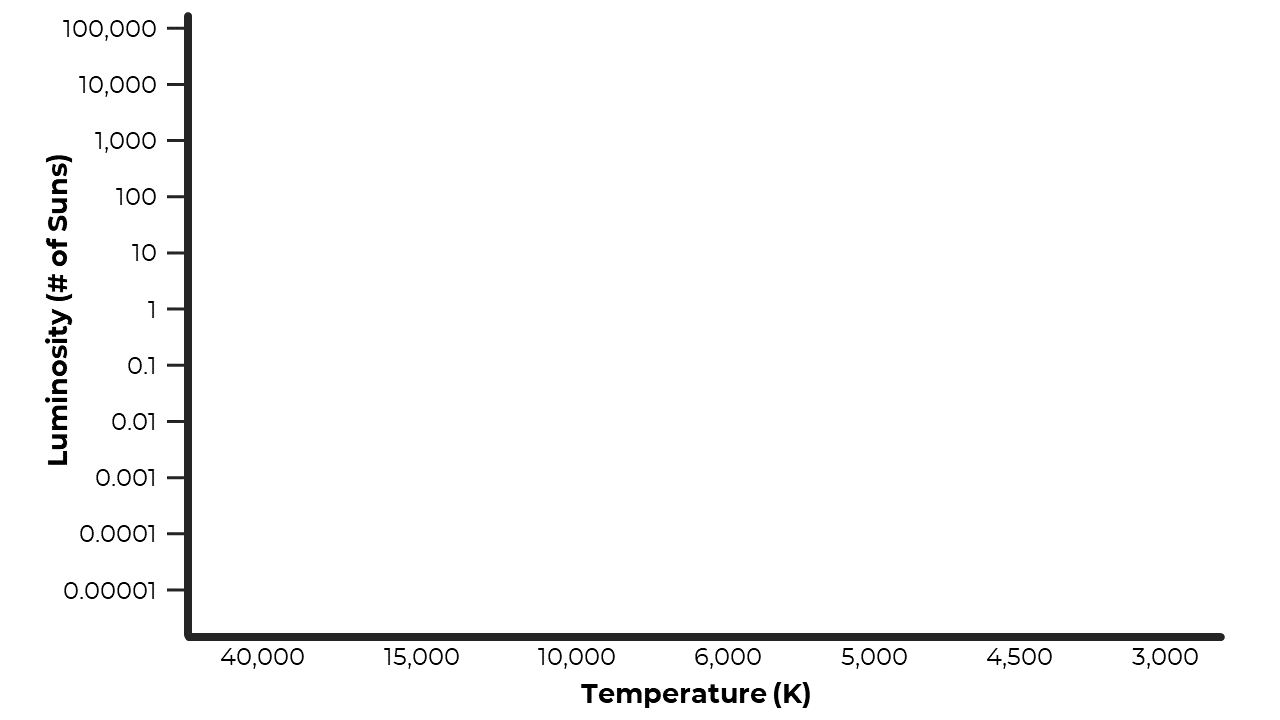
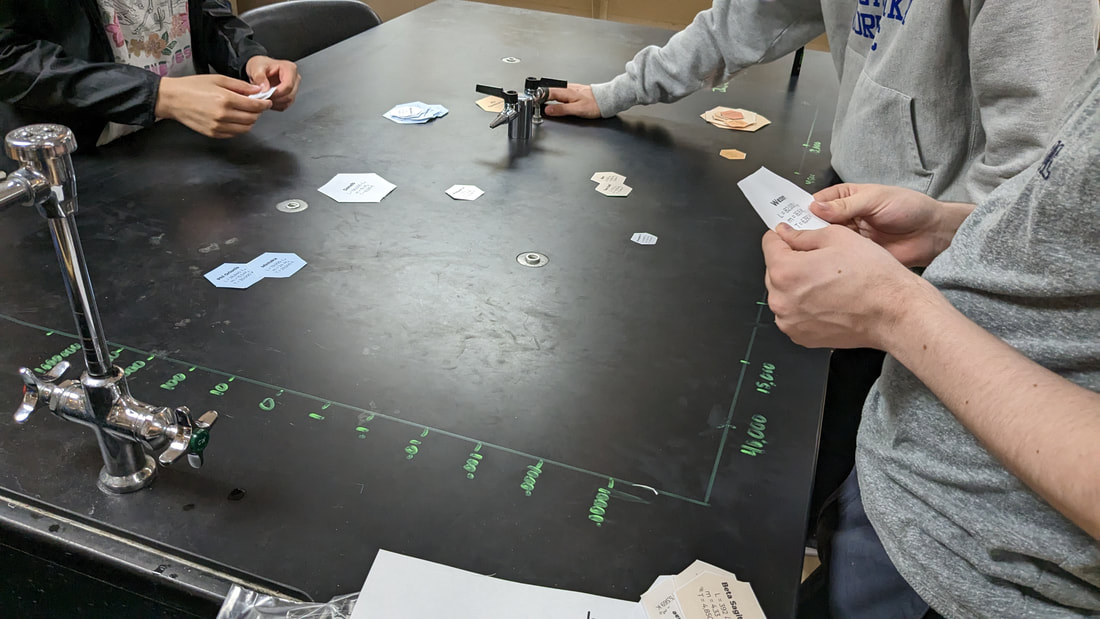
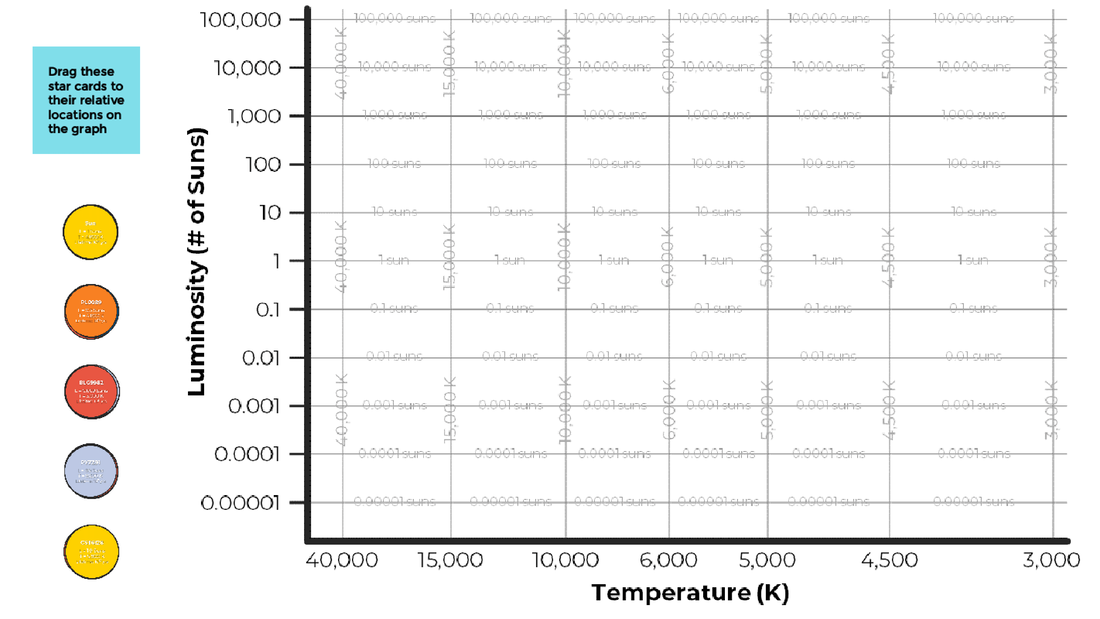
Since a typical H-R Diagram has a unique log scale and inverted temperature axis, I provide students with a template that they should use to set up and label their axes. This year, I just projected this blank example on the board and students transferred it to their lab benches using neon markers. I have also done this poster boards and with magnetic star cards on the front whiteboard but I liked this individual tabletop method the best. :)
Original Files
Version 2.0
Modification HistoryI've liked the task enough to use it for several years but there were a couple of things that I always wished were a little different and I finally took the time to make the updates that I've wanted. Updates made from the original to Version 2.0:
 After sharing version 2.0, several teachers reached out noticing that some of the stars were incorrect temperature, color, or both! In my first iteration, I never double checked the data from the original resource but now I was on a mission to make a version 3.0! Updates made from Version 2.0 to Version 3.0:
Virtual VersionUpdate: since Google has announced that they will be phasing out Jamboard in 2024. I have not updated this next section to Version 3.0. That said, I'll leave it up here on the blog for now for anyone that would like this option while it still exists... If you aren't able to print/cut enough cards or want to allow participation in an online setting, I've also created a Jamboard template to run this activity virtually. Noticing that students really needed to zoom in to read the star properties, I added gridlines with extra labels to the axes so that student didn't lose their bearings ;) The link below will force a copy of the Jamboard that I put together as a virtual version of this task. You can either modify this and share with students or give them this link for them to create their own copy and share it with the rest of their group. Downloadable FilesHere are the files one more time that you can modify, print, and use in your classroom. Let me know if you have any questions or ideas for this task.
Click for more Astrophysics resources ⬇
Comments
|

Joe CossetteFather, Physics Teacher, Knowles Fellow, Friend, Techie, and Musician Blog Posts |
|||||||||||||||||||||||||||||||||||||||||||||||||
 RSS Feed
