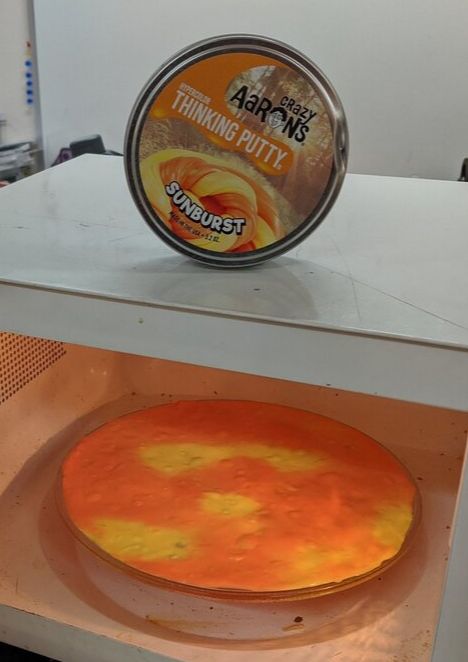
The PremiseOne of my favorite applications of standing waves and electromagnetic waves is a microwave oven. Using a pretty simple set up to locate the hot spots (antinodes of the standing microwaves), you can make some measurements to confirm the speed of light. Visualizing the Standing WavesSince we aren't able to see the standing waves occurring in real time, we need a way to find the hot spots. There are a variety of options that can work like a plate of chocolate chips, marshmallows, cheese, or old peeps (this video is the most underrated science video on youtube by the way). While I've had success with all of these options, I've had a hard time making them visibly obvious to a classroom full of students and I always struggle to get everything reset in time for the next class.
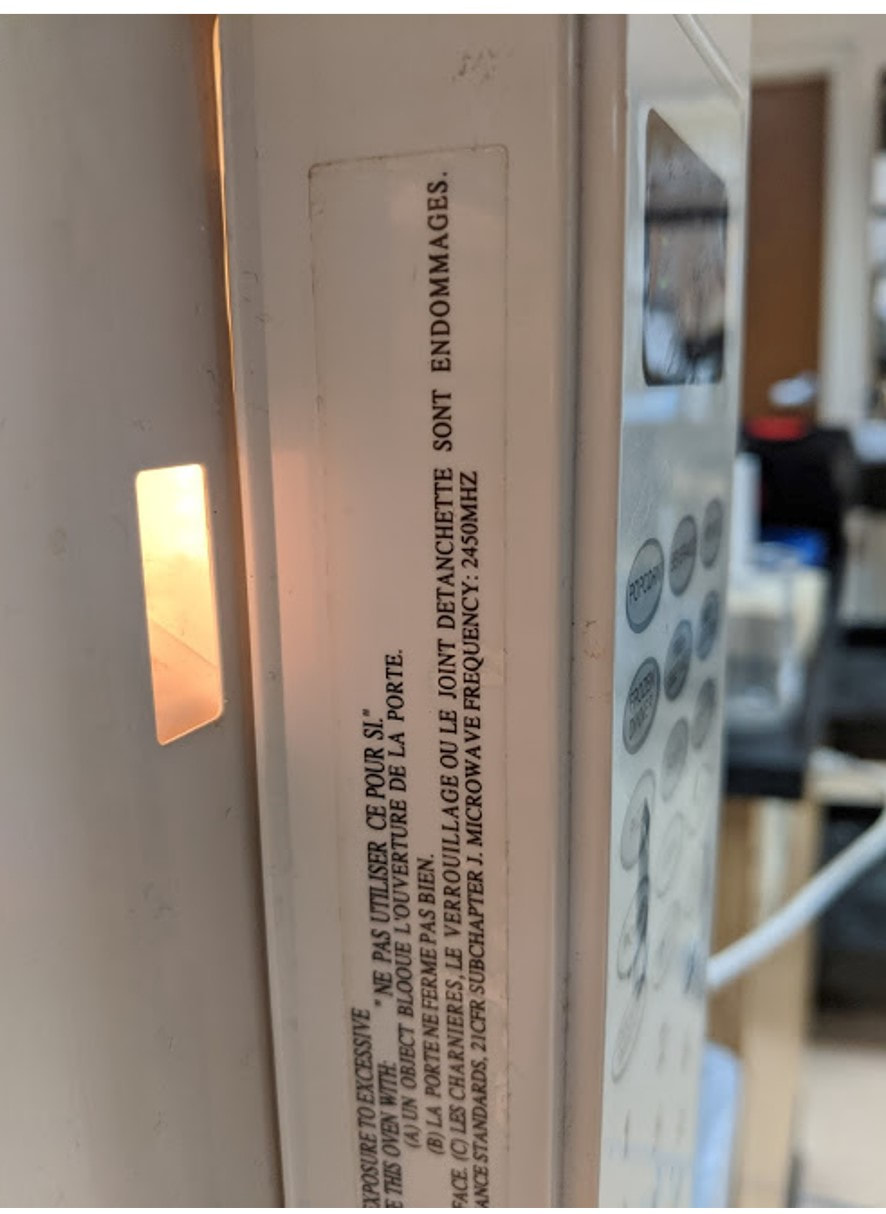
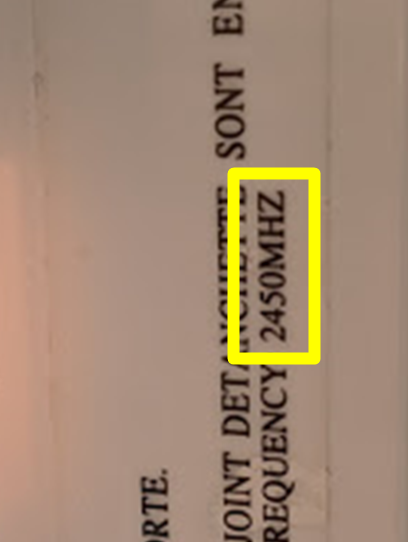
Collecting DataAll microwaves have a label (usually on the inside of the door) that includes the frequency specifications for the the magnetron inside. The "Microwave of Science" that I use in my classroom is rated at 2450 MHz (2,450,000,000 Hz)
With this frequency and the speed of light, the wave speed equation can be used to calculate the wavelength of the microwaves. Each antinode in the standing wave will result in a hot spot so the hot spot spacing should be about half of the calculated wavelength. (see the slide below) 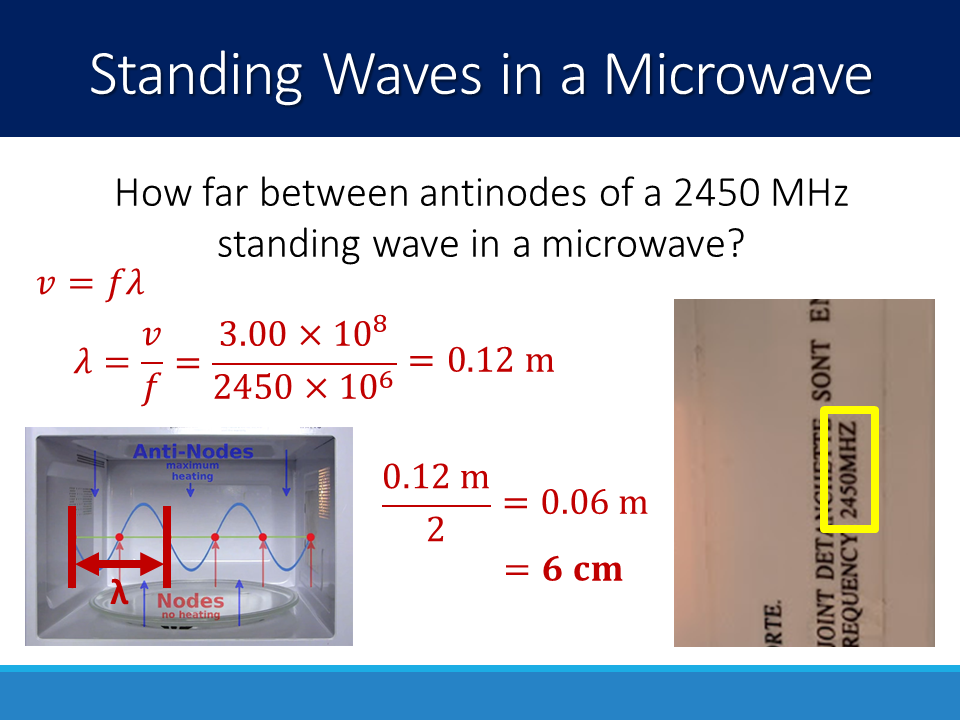 Once you calculate a predicted hot spot spacing, you can confirm the theory by measuring average the spacing between the visible hot spots in the thermal putty (or chocolate, marshmallows, etc). I have also done this process in reverse and used the spacing and frequency to "measure" the speed of light. I think I prefer ending with the putty measurement but it really depends on where you are at with your class and what your goals are. 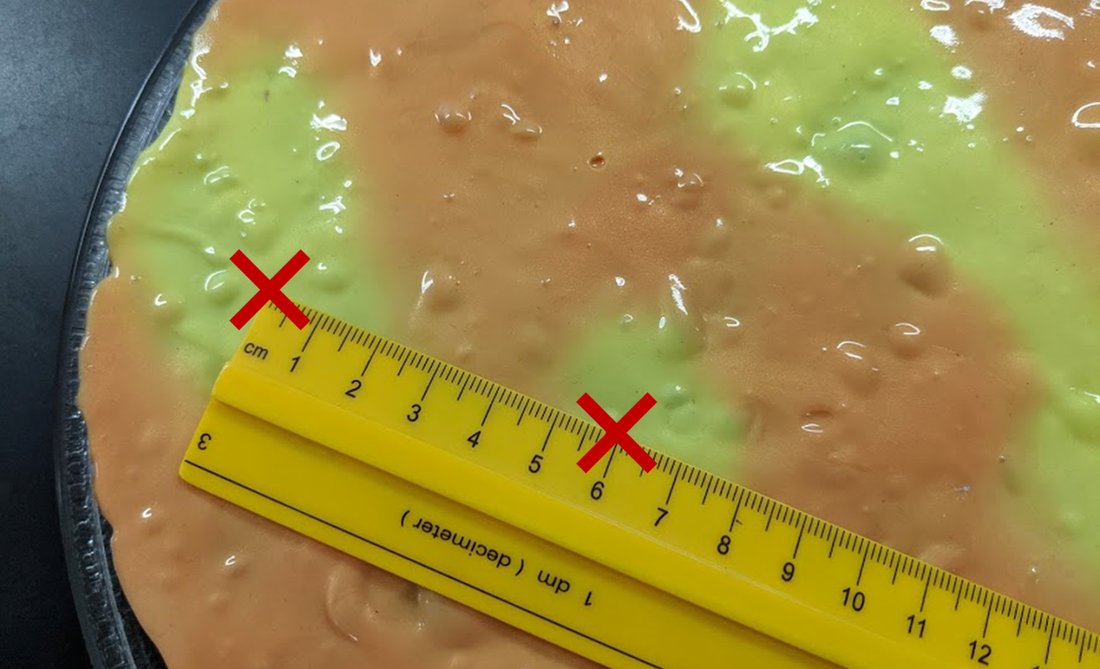 This post is part of larger collection of my favorite science demonstrations CLICK HERE FOR MORE DEMOSClick for more Waves resources ⬇ 
Comments
|

Joe CossetteFather, Physics Teacher, Knowles Fellow, Friend, Techie, and Musician Blog Posts |
 RSS Feed
